
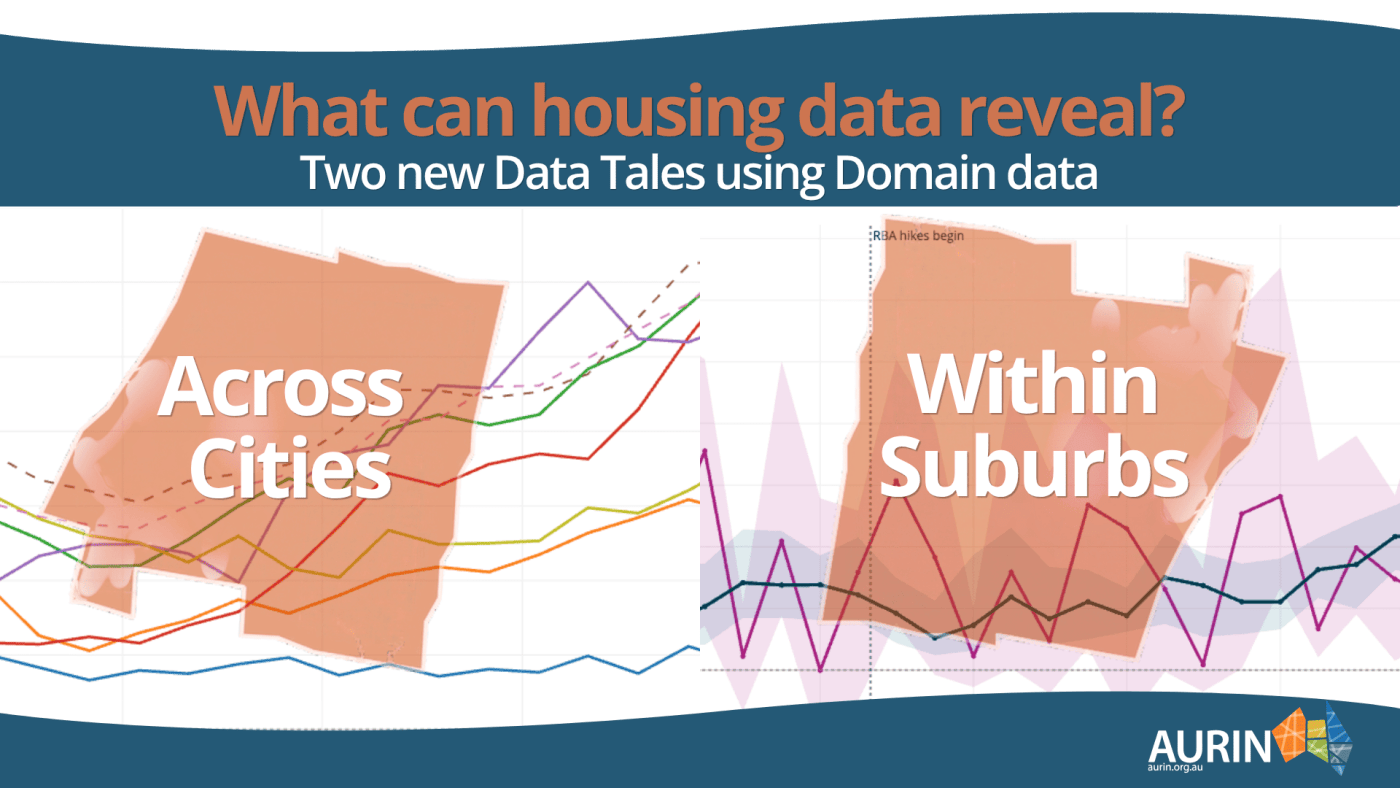
How have house prices changed across Australian cities? And what can a city-wide measure hide about its suburbs?
Two new AURIN Data Tales explore these questions using Domain property data, now available to approved Australian researchers through AURIN.
By tracking long-term trends and comparing individual property records, the tales show two ways to put this data to work. Explore the findings, see how the analysis was built and find ideas for your own research.
Compare housing trends across cities
The Great Divergence: A Decade of Australian House Prices explores how housing markets have changed across eight Australian cities and coastal markets.
Using quarterly suburb statistics, the tale tracks house prices, compares growth in houses and units, and examines rental yields. It shows how markets such as Brisbane and Perth have followed very different paths from Melbourne.
The analysis uses a sample of 30 suburbs in each market. It offers a starting point for exploring differences between places and identifying trends that warrant a closer look.
For researchers, this shows how Domain data can support questions about housing costs, changing market conditions and the gaps between cities over time.
Look beyond the city-wide figure
A broad view can reveal a trend. But what happens when you zoom in?
Inside a Flat Market: A Magnifier on Melbourne compares Melbourne suburbs of Hawthorn and Frankston to explore what Melbourne’s relatively flat house prices conceal.
The tale combines individual property records with suburb statistics. It examines price growth, time on market, sales methods and the mix of homes sold. It also compares properties with the same bedroom count to help separate price changes from changes in what sells.
Together, these measures reveal distinct local markets within the same city. The tale also shows why sample size matters, particularly when a detailed comparison leaves only a few sales in each quarter.
Use Domain data in your own research
These tales offer two starting points: use suburb statistics to find broader patterns, then explore property records to investigate local differences.
Both include code behind the charts, with supporting training materials to help you adapt the approach to your own study area and research question.
Domain data is available through AURIN to approved Australian researchers with an eligible institutional affiliation and a signed data agreement.
Learn more and request access to Domain data