
SUMMARY
- Arts and Recreation Services have been one of the most disrupted sectors affected by the COVID-19 pandemic so far in 2020. Closure and restrictions have hampered the regular operation and use of cultural and sports venues, including museums, galleries, theatres, gyms and stadiums.
- According to the latest ABS Payroll Jobs and Wages Index data (September 2020), there are 12% less jobs in this sector, compared to March 2020.
- The data also reveals a gender and age imbalance among population groups, as up to 30% of women and 60% of workers under the age of 20 were the most affected by job loss since the start of the pandemic.
- In the creation of healthy and liveable cities and communities, culture and recreation aspects are key elements. Losses in this sector could have long-term detrimental impacts:
“The ability of a community to successfully organize its culture, be it through museums, libraries, theatres, cultural participation or cultural development, then is a quantifier for its ability to innovate. A cultural event, therefore, can be so much more than an activity that stimulates the local economy or celebrates a political achievement. Placed within the right framework, culture makes cities and communities smarter.” (The Museum of the Future, 2019)
Researchers and policy-makers can use the latest available ABS data in combination with AURIN data to investigate the needs of vulnerable groups within this sector and ensure recovery efforts include Arts and Recreation as part of healthy and thriving communities.
DATA EXPLORATION
To explore this dynamic situation, we used spatial and non-spatial data from the ABS and AURIN. This included:
- Insights were drawn from the Department of Education, Skills and Employment – 2019 Australian Jobs report to understand general employment aspects in the Arts and Recreation services.
- Updated ABS Weekly Payroll Jobs and Wages Index data from 14 March to 19 September 2020 was used to showcase employment changes to individual states, sex and age groups.
- Australian Bureau of Statistics – Data by Region – Economy and Industry data from 2016 was used to understand the proportion of population employed in the Arts and Recreation industry at Statistical Area 2 level (SA2). Total employed population numbers were included for as well, to understand population distribution.
- Australian Bureau of Statistics – Labour Force Statistics from September 2020 was used to understand latest employment participation rates by sex.
We encourage researchers to access this spatial datasets and explore the AURIN Data Catalogue for more socio-economic and health data, as well as request further datasets for their research that may not be available yet.
UNDERSTANDING THE IMPACTS OF COVID ON THE ARTS AND RECREATION SERVICES SECTOR
Employment in the Arts and Recreation Services is subject to seasonality and other variability factors such as timing of sports, music and film festival events, etc. While the 2019 Australian Jobs report shows that Australia’s annual employment growth has been fluctuating over the last ten years (Figure 1), overall there has been growth of 17.7% since November 2013, with the sector recording 244,500 employees in November 2018 (Figure 2). From this point the sector was projected to grow a further 8.7% over the five years to May 2023, particularly the Sports and Recreation subsectors. Due to the ‘people-facing’ nature of jobs in these sectors (including sports coaches, fitness instructors, sportspersons, music professionals, event organisers, actors, dancers and entertainers, etc.), and total employment and the projected increase are likely to be severely disrupted by the COVID-19 pandemic.


Figure 1: Annual employment growth (%) in the Arts and Recreation Services. Image source: DESE (2019). Figure 2: Arts and Recreation Services overview. Image source: DESE (2019).
A cross-sectional view of the Arts and Recreation Services sector shows this workforce can be described as relatively young compared to others, with 27% of employees falling in the 15-24 years old age group, working in urban areas (as shown in Figure 2 above). Looking into the detail, 58% of employees in this sector hold a vocational or higher education degree, while 38% hold no post-school qualifications. As shown in the previous case study, people working in a highly skilled job are likely able to work remotely, while those without a qualification are more exposed to the risk of job-loss while restrictions remain in place.
IMPACTS OF COVID-19 IN THE ARTS AND RECREATION SERVICES
Ongoing COVID-19 restrictions on large public gatherings in most states and territories have caused considerable disruptions in this important sector. While certain activities such as fitness classes, concerts and film festivals were able to quickly switch to digital platforms, it is uncertain if these changes will remain successful into the future, particularly as larger venues such as concert halls, theatres, galleries, stadiums, gyms may be unable to operate at full capacity and remain viable for some time due to social distancing restrictions (DoH, 2020). These limitations may have long-term detrimental consequences to employment in the Arts and Recreation sector, particularly in the state of Victoria where a ban on all non-essential business activities has been in place (DHHS, 2020).
While understanding that fluctuations in the Arts and Recreations Services job market are possible (Figure 1), COVID-19 will likely be adding extra pressure, particularly after considerable job losses have been recorded in most states and territories since the start of the pandemic.
The ABS created the Payroll Jobs and Wages Index (used in the charts below) to measure the impact of COVID-19 on employment across different sectors, states and territories, and allows a direct comparison of changes between different points in time. The point of reference is the week ending March 14 2020, when the 100th positive COVID-19 case was recorded, with a corresponding index of 100. Further explanation to the use of the Index and a timeline are available in the previous case study.
Latest national ABS Payroll Jobs Index data reveal that employment in this sector experienced considerable contraction since the start of the pandemic (Figure 3). Victoria recorded the highest contraction with 24.1% less jobs, followed by South Australia and New South Wales who recorded 12.9% and 11.1% fewer jobs in Arts and Recreation Services.

Figure 3: Arts and Recreation Services payroll jobs index. Data source: ABS (2020).
A closer look at the ABS Payroll Index by age groups) reveals that 15-29 and over 70 groups experienced the greatest job loss since March 2020 (Figure 3). The data also shows that by the week ending May 23, nearly 60% of jobs were lost for employees under 20. While the sector is showing signs of recovery, employment at the end of September 2020 remains 15% below the March figure for those under 20.
These figures are particularly concerning when taking into account that 27% of the Arts and Recreation Services workforce falls in the category 15-24 years old (Figure 1). This could mean that a considerable proportion of employees may be experiencing financial hardship (Figure 2).
Further exploration of the ABS Payroll Index data shows a jobs decline of up to 30% for the female workforce and 23% decline for males (compared to March 2020), exposing an employment gender gap that may see women put further at risk of financial hardship in the current climate (Figure 5).
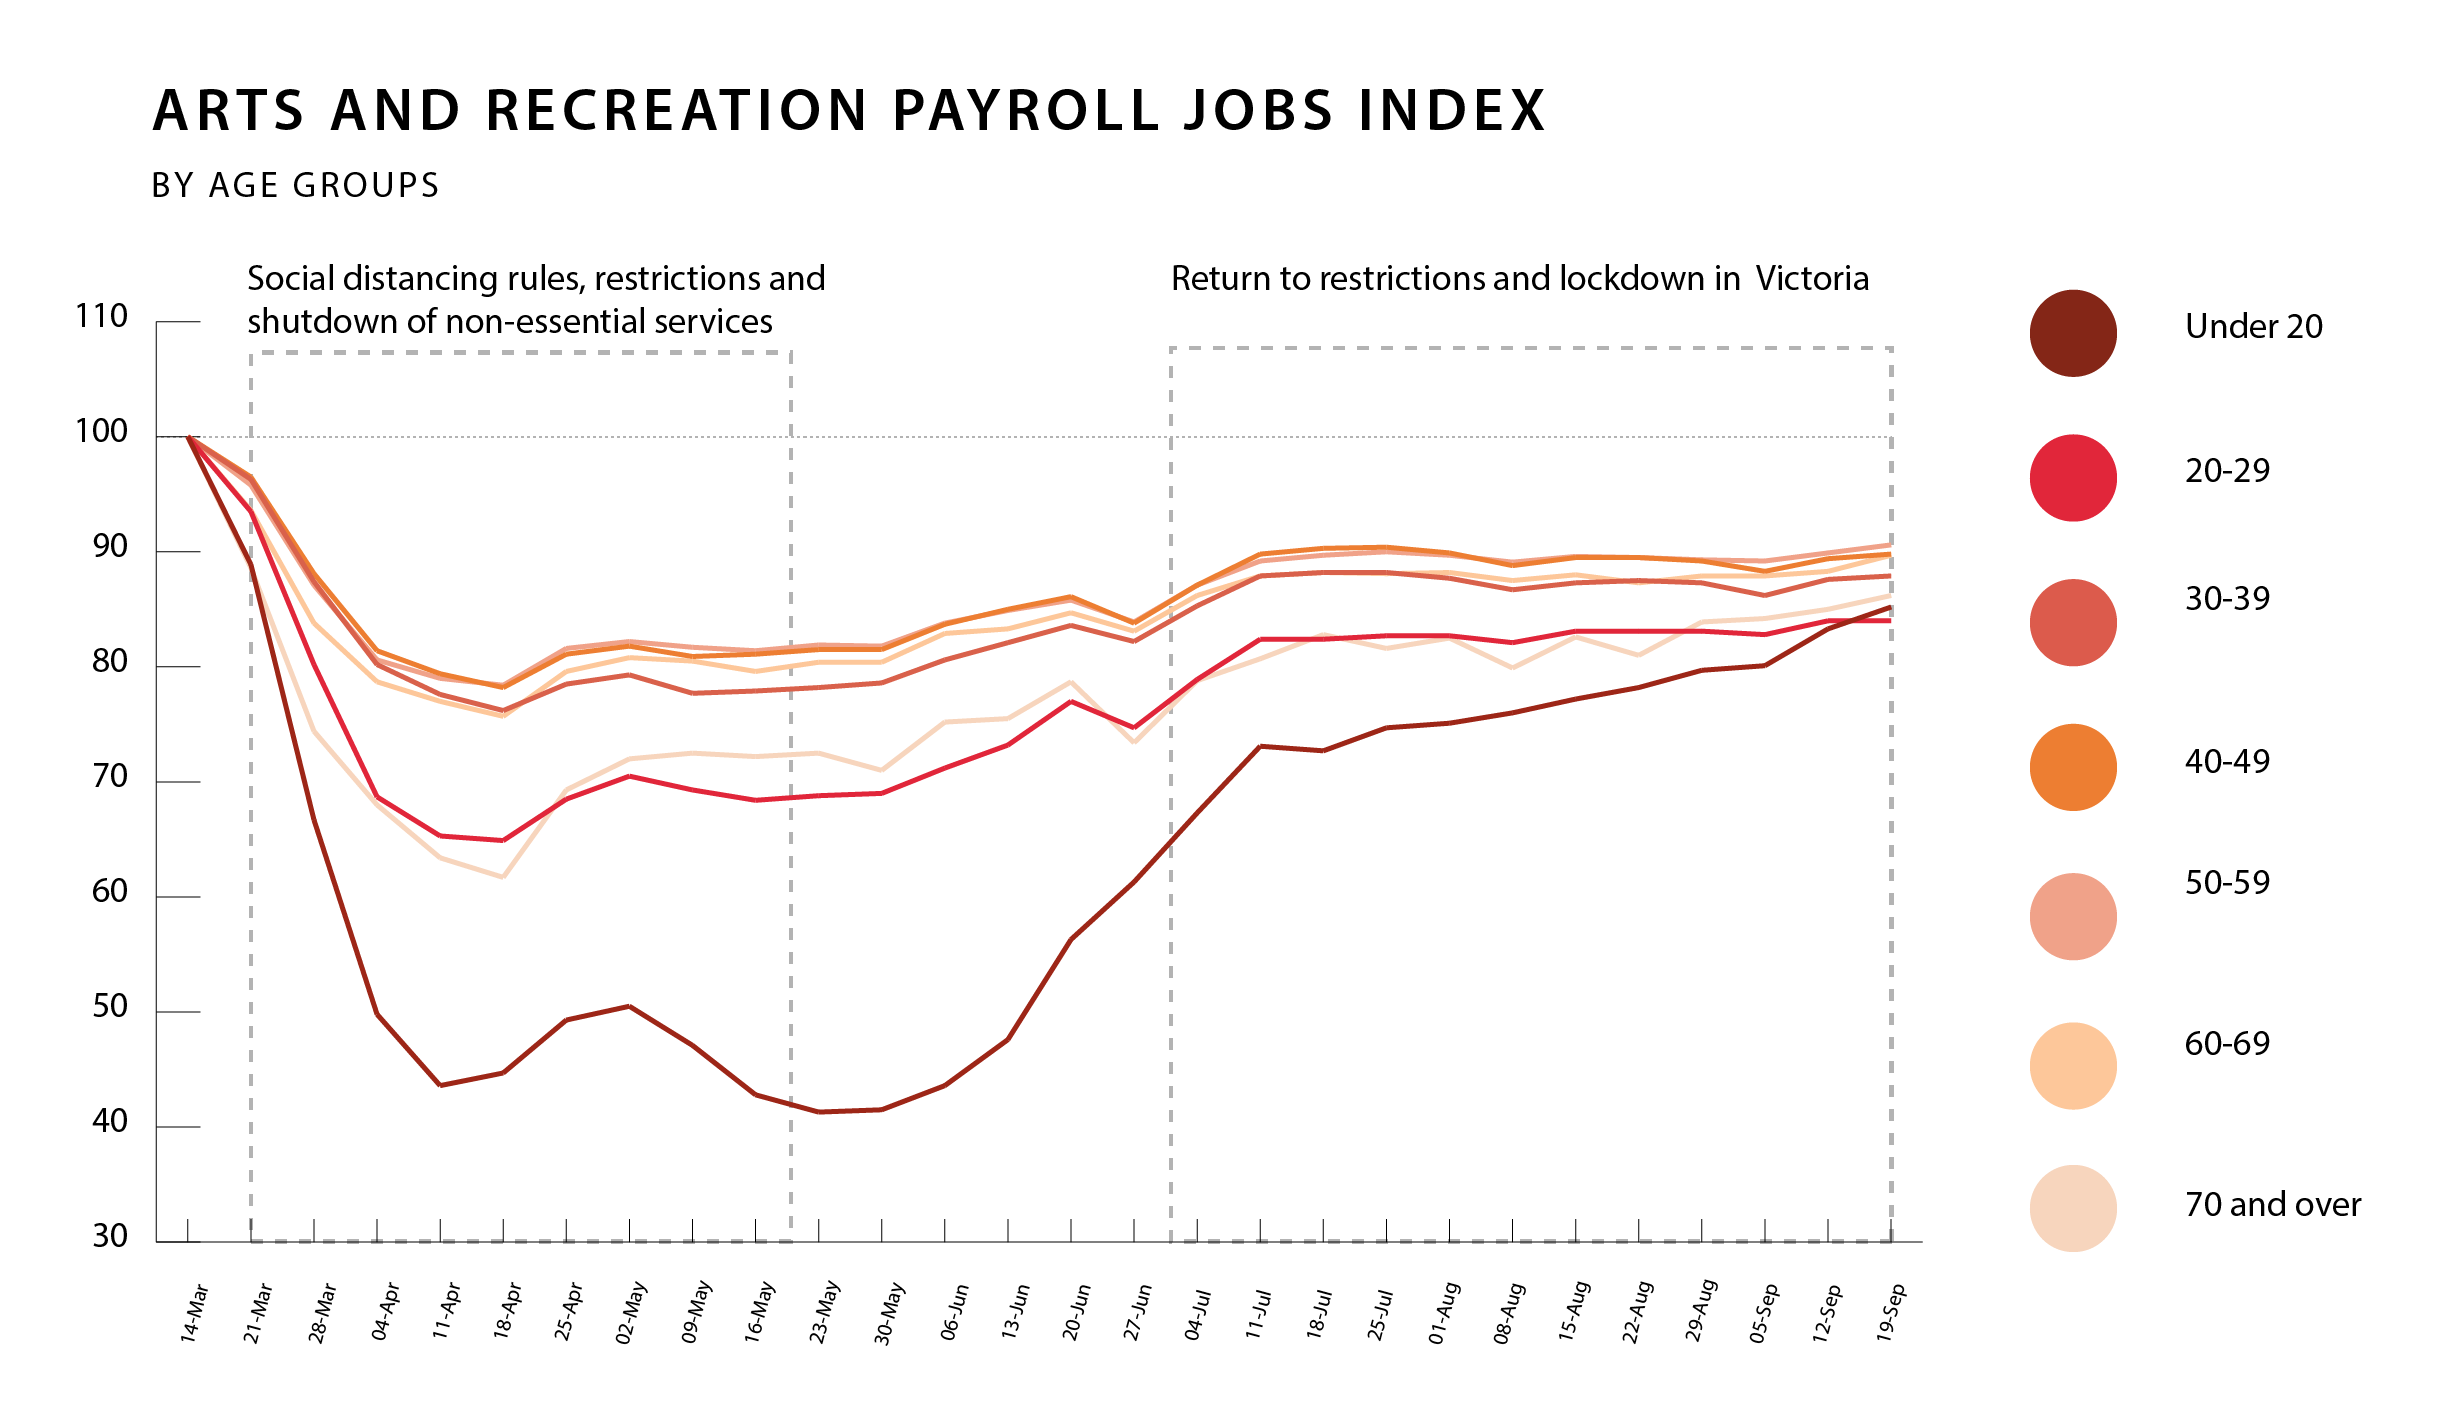

Figure 4: Arts and Recreation Services payroll jobs index by age groups. Data source: ABS (2020). Figure 5: Arts and Recreation Services payroll jobs index by sex. Data source: ABS (2020).
These figures align with the broader employment situation in Australia, as shown by the September ABS Labour Force statistics (Figure 6). The overall female participation rate was 61.2% in the week ending March 20 and declined 3.7% to a record low of 57.5% in the week ending May 20. In the same period of time, the male participation rate was considerably higher at 70.8% and declined 2.8% to a record low of 68% in the week ending May 20.

Figure 6: Employment participation rate by sex – seasonally adjusted. Data source: ABS (2020).
These data are consistent with findings from the previous two case studies, where female workers in Retail and Accommodation and Food Services suffered comparable job loss.
“Hospitality, the arts and administrative services have all been hit hard. These sectors are dominated by women, which is one reason women’s employment has taken a bigger hit this year.
Yet these sectors received next to nothing in the budget. They are also less likely to benefit from economy-wide supports such as instant asset write-offs because they are the least capital-intensive sectors.” (Grattan Institute, 2020)
MAPPING THE ARTS AND RECREATION SERVICES SECTOR
A national map of ABS Economy and Industry data (Figure 7) reveals the distribution of Arts and Recreation Services employment across urban and regional areas in Australia. While the Arts and Recreation Services sector is relatively small compared to other industries, data presented in Figure 1 above shows that it is particularly subject to fluctuations with the added hardship due of restrictions (i.e. event closures and travel bans) imposed by COVID-19 responses.
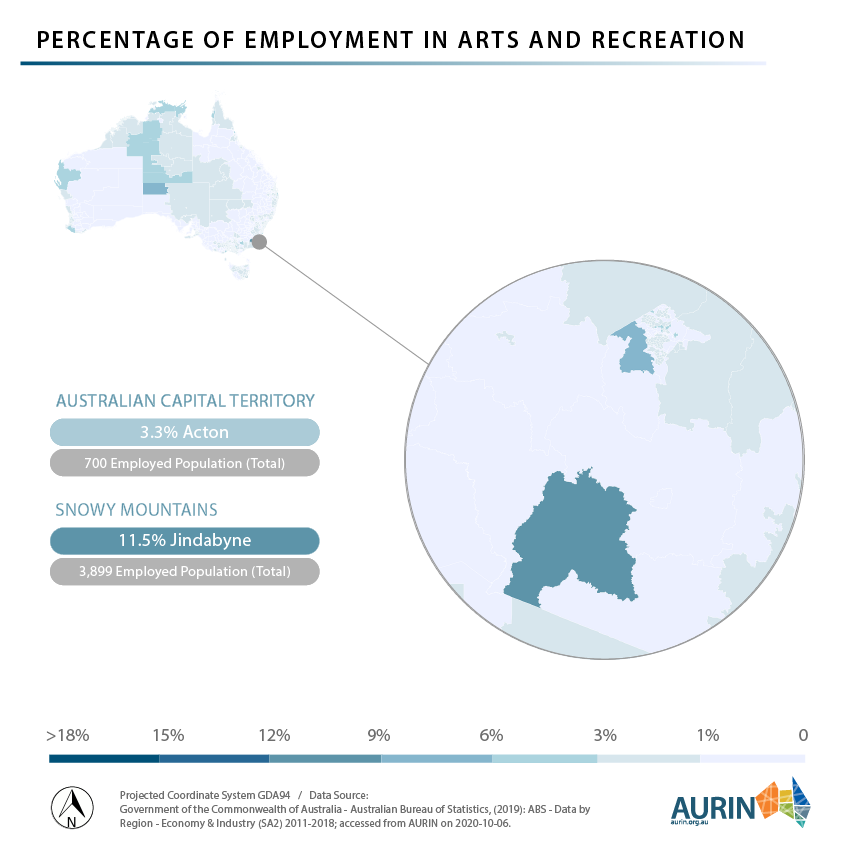
Inner city areas in Melbourne, Sydney, Hobart, Darwin and Canberra typically attract sports and cultural venues (i.e. galleries, museums, cinemas, gyms, stadiums) and employ between 3-4.5% of the working population in the Arts and Recreation Services sector. Travel destination areas in smaller cities and regional towns such as Gold Coast (Figure 8), Blue Mountains (Figure 9), Phillip Island, Lorne-Anglesea and Bright (Figure 11) employ a similar proportion in this sector. Jindabyne – Berridale SA2 in the Snowy Mountains (Figure 10), a renowned destination for winter sports, employs 11.5% of population in the Arts and Recreation services, one of the highest rates in the country. Communities in parts of Australia, such as Aṉangu Pitjantjatjara Yankunytjatjara, Petermann-Simpson and Tanami employ between 4.1 and 6.3% in the Arts and Recreation sector and are home to important Aboriginal and Torres Strait Islander art and cultural centers (Figure 15). Sports, such as the AFL, play an important cultural and educational role in remote regions of Western Australia and the Northern Territory.

Figure 7: Percentage of persons employed in retail by Statistical Area 2. Data source: ABS (2016).


Figures 8-15: Percentage of persons employed in retail by Statistical Area 2. Data source: ABS (2016).
When comparing employment across urban and regional SA2s, it is important to also consider the employed population size, especially because SA2s vary in area and population density. The ABS Economy and Industry data shows that in Sydney’s eastern SA2 Coogee-Clovelly 3.1% of population works of a total employed population of 14,144 in Arts and Recreation Services sector. When comparing to Jindabyne – Berridale SA2 in the Snowy Mountains, 11.5% work in this sector, however, the total employed population is 3,899 (Figure 16).
Urban areas are more densely populated and may feel the brunt of COVID-19 restrictions more than regional areas (i.e. in the state of Victoria). However, regional areas – while more sparsely populated and less restricted by COVID-19 policies (i.e. in the state of Victoria) may experience a higher economic impact, especially if these areas rely on domestic and international visitors for income and employment while state and international travel bans remain in place.

Figures 16: Percentage of persons employed in retail by Statistical Area 2. Data source: ABS (2016).
In the case of remote communities, these have a “much less diversified economy” (OECD, 2020) than urban areas that are likely to be more susceptible to the economic impact of COVID-19 through closures and travel restrictions. According to the Desart Impact Statement, the 2019/20 financial year recorded a considerable decrease in sales of artworks (30%) and average number of artworks produced and sold (59.7% and 46% respectively), compared to the previous financial year.
It is important to note that there is huge diversity across the sector; for example, Victorian AFL clubs were able to relocate and still receive funding, while the Arts sector only received limited recovery support.
We invite researchers to access AURIN and further explore this dataset, investigate how policies drive or decrease the demand for certain jobs and services, as well as contribute to a better understanding of the impacts of COVID-19 on Australian businesses and employment.
As the COVID-19 pandemic continues to create employment vulnerability in many industries which creates a wide variety of research possibilities. Please stay tuned as we will be showcasing data to explore the Arts and Recreation sector.
How can we help you with your research? Please click here to get in touch, or email support@aurin.org.au
Our expert, interdisciplinary team is available to discuss your research needs and provide guidance on the use of AURIN datasets.
This article was written by:
