If a picture tells a thousand words, a map can tell a million.
AURIN is developing a series of interactive story telling maps – AURIN Data Tales – to highlight the data access and analytics capability we offer and provide real-world examples of urban challenges, presented in an engaging way to inspire further research and data driven decision-making. We translate complex findings that can lead to impactful changes for Australia.
We kick off our series with AURIN Data Tale: Same City, Different Worlds – A tale of two suburbs, highlighting findings from the Australian Institute of Health and Wellbeing’s 17th biennial welfare report. Australia’s Welfare 2025 serves as a ‘report card’ on the welfare of Australians by looking at how we are faring as a nation.
Rapid urbanisation – inequitable access
As Australian cities urbanise, challenges associated with rapid urbanisation are coming to the fore, particularly the need to deliver equitable access to services.
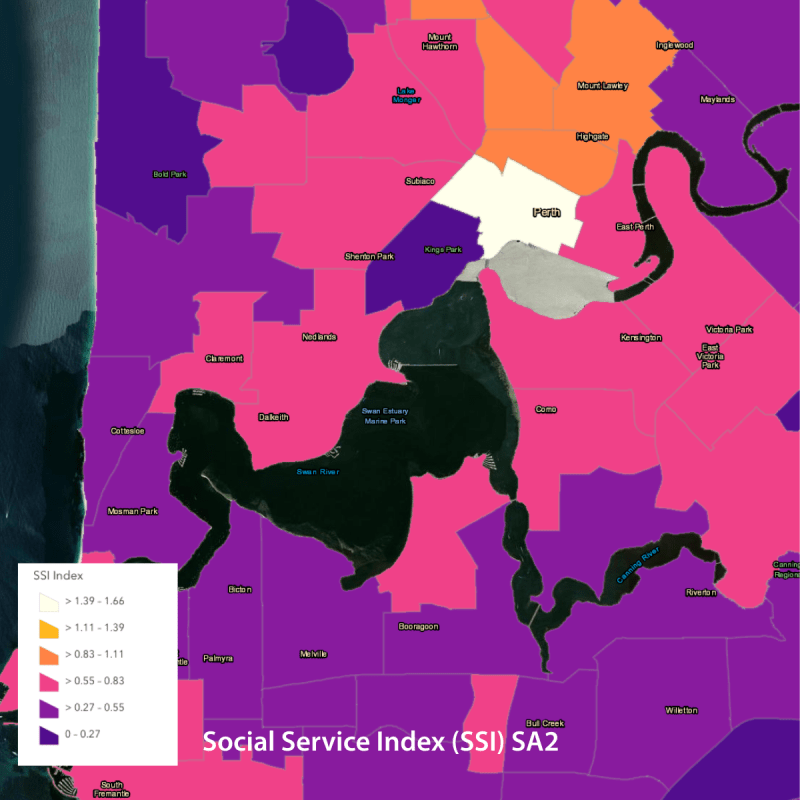
To respond to this critical challenge, it is necessary to observe changes across the built environment, the socio-demographics of locations and other relevant factors. The report finds that access to services in urban areas is unevenly distributed throughout cities resulting in considerable inequality.
Australia’s Welfare 2025 highlights the importance of access to comprehensive and comparable national data collections, analysis and insights. It offers an overview of the current state of welfare and wellbeing in Australia, while also shedding light on the data landscape that underpins the findings.
A tale of translation
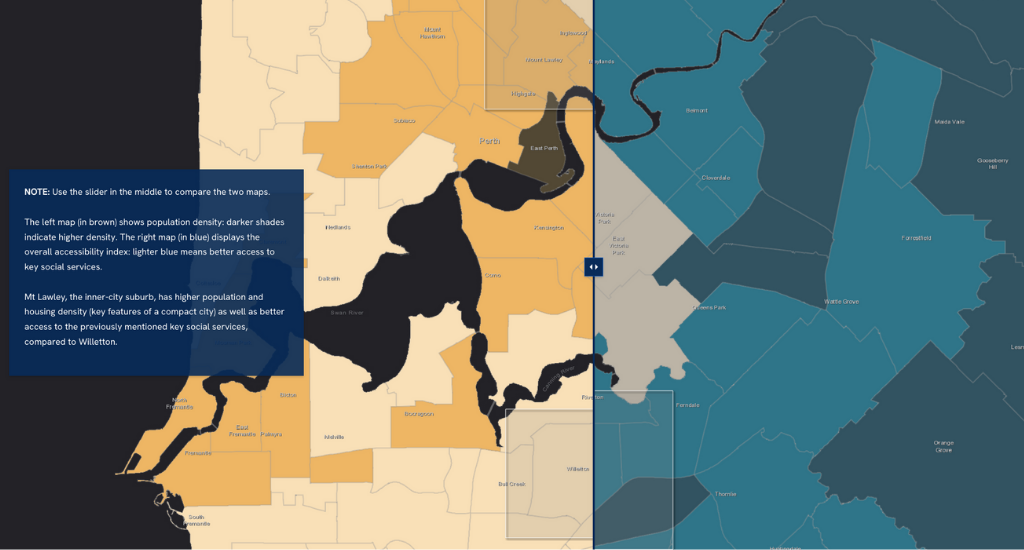
Our Data Tale provides a data-driven glimpse into these critical issues using two suburbs in Greater Perth as an example. It highlights the importance of considering spatial equity in urban planning decisions across Australia and supports deeper understanding of how research findings can illustrate challenges and posit solutions.
This Data Tale was brought to you by….
The research that underpins our Data Tale was supported by the Australian Government through the Australian Research Council’s Centre of Excellence for Children and Families over the Life Course.
Datasets Used:
Health providers data was obtained from the National Health Services Directory, a national directory of health services and providers maintained by Health Direct Australia . This data includes providers, service types (i.e. pharmacy, family practice, mental health, etc.), opening hours, billing practices, service address, and latitude/longitude.
Childcare facility data was obtained from the Australian Children’s Education & Care Quality Authority (ACECQA) National Register. This data includes providers, provider street address, number of places, hours of operation, and service quality ratings.
General Transit Feed Specification (GTFS) files for all Australian public transport providers were downloaded from the Mobility Database Catalogs repository.
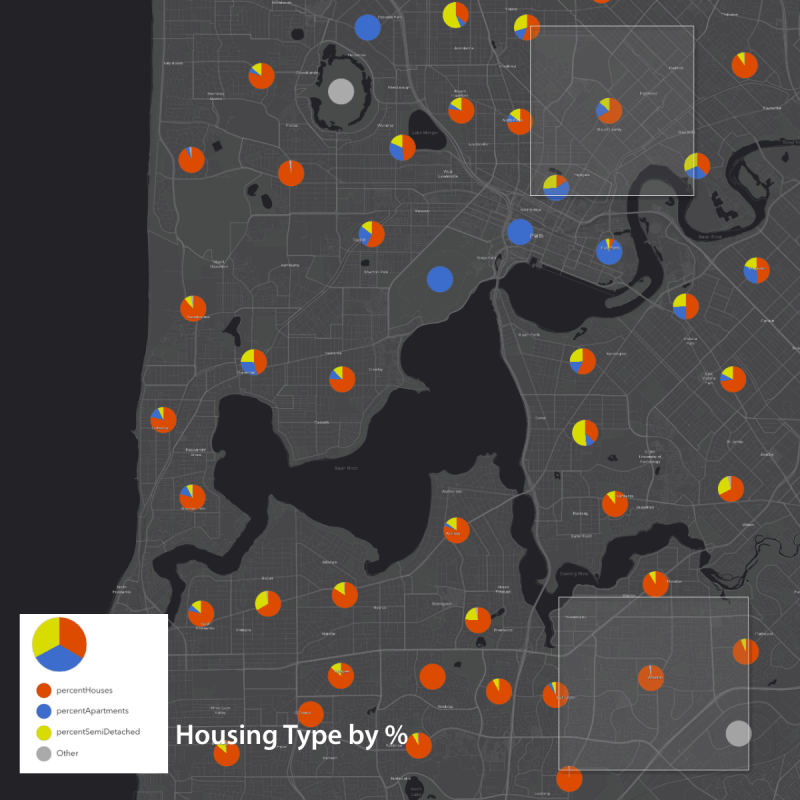
Data from the Australian Bureau of Statistics 2021 Community Profiles and the Socio-economic Indexes for Areas (SEIFA) was used at a SA1 and SA2 level for, including population density, age distributions, and housing types.