
CONTEXT
Retail has been one of the most affected industries during the COVID-19 pandemic. National and statewide restrictions have disrupted the operation of many retail stores as areas have gone into lockdown to prevent the spread of the virus.
These restrictions are clearly visible in Victoria’s data as it reentered lockdown in early July. Retail jobs were lost and business owners had to rethink their sales and delivery strategies to continue operating while complying with regulations.
The following analysis demonstrates the use of readily available AURIN data to spatially identify areas that may be most affected by restrictions, as well as population groups affected by job losses. Researchers and policymakers can use these (and many other) datasets to perform in-depth analysis to target vulnerable areas and increase recovery efforts where they are most needed.
DATA EXPLORATION
For this case study, we used information from readily available spatial and non-spatial data to start to reveal the broader context and background of this complex and dynamic situation:
- Insights from the most recent ABS Retail Trade data release were drawn to provide context to the turnover and performance of individual subindustries, states and territories.
- Latest ABS Weekly Payroll Jobs and Wages data was used to uncover job loss and recovery of individual age groups and gender.
- The Australian Bureau of Statistics – Data by Region – Economy and Industry release was used to reveal the proportion of population employed in the Retail industry, as well as employed population numbers at the Statistical Area 2 (SA2) level.
- The Australian Bureau of Statistics – Socio-Economic Indexes for Areas (SEIFA) broadly defines relative socio-economic advantage and disadvantage as “people’s access to material and social resources, and their ability to participate in society” (ABS, 2018). In the context of COVID-19 pandemic, the SEIFA Index of Education and Occupation ranking is used to discern areas that are most (and least) susceptible to employment vulnerability in the Retail industry.
We invite researchers to access these spatial datasets and explore the Data Catalogue for more socio-economic and health data, as well as request further datasets for their research, that may not be available yet.
UNDERSTANDING THE RETAIL SECTOR
The following graphs have been derived from the original ABS Retail Trade and Payroll Index data to reveal developments in the Retail industry since the start of the pandemic, especially in the state of Victoria, as non-essential shops remain closed under ongoing restrictions.
Increased disposable income and online shopping availability have driven an unprecedented demand for parcel deliveries, to the extent that delivery services are pushed beyond capacity:
“Accommodation and food was by far the hardest hit sector, with output down a whopping 39 per cent in the three months to June 30.” (ABC News, 2020)
July figures from the latest ABS Retail Trade data indicate the adaptability of some retailers to meet higher than usual demand for online trading (Figure 1). The month of April 2020 recorded an online turnover of 11% out of the total retail. This represents the highest online turnover so far and has nearly doubled compared to April 2019 figures.
In the food sector, sudden demand for online groceries at the early stages of nationwide lockdown exceeded supermarkets’ capacity to deliver, forcing some areas to halt online orders for five weeks. Online food sales recorded a 64% increase in April 2020, compared to the same month last year (Figure 2).
Non-food sales experienced an increase of 105% in April 2020, compared to the same month last year, the highest increase in monthly online turnover recorded. (Figure 2).


Figure 1: Monthly Online Retail Turnover. Data source: ABS (2020). Figure 2: Online retail turnover comparison April 2019 and 2020. Data source: ABS (2020).
A closer look into ABS Retail Subindustries data reveals the top four sectors that recorded the highest monthly turnover during the last five years: food, household goods, cafes, restaurants and food services, as well as pharmaceutical, cosmetic, toiletry, recreational goods, newspaper and book retailing (which are included in the “Other retailing” category).
Uncertainty and fear at the beginning of the pandemic in March may have led many Australian households to prepare for self-isolation, as nation-wide restrictive policies were announced by the Federal Government. As shoppers stocked up on food, essential items and possibly whitegoods to store perishable groceries, percentage change in monthly retail turnover (month-on-month) confirms spending behaviour in these sectors (Figures 3 and 4):
The food sector recorded a 24% turnover increase in the month of March, while Household goods recorded nearly 16% increase in the month of May. On the other hand, hospitality services including cafes, restaurants and takeaway recorded a downturn of 23% in March and further 35% decrease in April, followed by a slow increase of 9% in May coinciding with nationwide easing restrictions and increased disposable income, according to quarterly ABS National Accounts data. Clothing, footwear and personal accessories recorded considerable decrease of 23% in March, and further 53% decrease in April, and followed by a surprising growth of 129% in May.


Figure 3: Retail subindustries turnover July 2020. Data source: ABS (2020). Figure 4: Retail subindustries turnover July 2015 – 2020. Data source: ABS (2020).
While all Retail subindustries are showing signs of growth and recovery, a look into the latest available ABS Payroll Jobs data reveals that employment in the Retail Trade sector has suffered considerable job losses in most states and territories (Figure 5). The largest decrease in jobs can be observed in the state of Victoria, which recorded 7.1% less jobs than at the start of the pandemic. Other states affected were New South Wales with a 2.8% decrease and Tasmania with 3.2% decrease. This could indicate reduced salesforce jobs for people working in brick-and mortar stores, while efforts are shifted towards online sales and dispatch.

Figure 5: Retail Payroll Jobs Index by State. Data source: ABS (2020).
So the big question is — why so many jobs were lost, despite retail trade recording a higher turnover compared to last year?
Visualisation of the payroll jobs index data reveals that certain population groups were more affected by job losses in the Retail sector than others (Figures 6 and 7).
The ABS Payroll Index was created to provide a weekly estimate of the impact of the pandemic on Australian employment, and allows a direct comparison between different points in time. The week ending 14 March represents a point of reference as the 100th positive case of COVID-19 was recorded. The latest data shows that female retail workers have lost up to 5% more jobs than men during the pandemic in Australia, as the index recorded a low of 89 for females and 94 for men, respectively (Figure 6). While jobs in the retail sector are showing signs of recovery and the employment gap appears to be narrowing, female retail employees still remain 2% behind male retail employees. This agrees with the July statement that:
“Women are more vulnerable to COVID-19 related economic effects because of existing gender inequalities.” (McKinsey & Company, 2020)


Figure 6: Retail Payroll Jobs Index by Sex. Data source: ABS (2020). Figure 7: Retail Payroll Jobs Index by Age Groups. Data source: ABS (2020).
A further look at population groups working in the Retail sector in the ABS data (Figure 7) reveals that those between 20-29 and over 70 have experienced greatest hardship due to loss of employment. While the under 20 group initially suffered up to 12% job loss after restrictions were applied – they have shown signs of resilience, with employment levels rising 10% above March figures.
MAPPING EMPLOYMENT IN THE ACCOMMODATION AND FOOD SERVICES SECTOR
A map of Economy and Industry data from the ABS (Figure 8) illustrates the diversity of retail employment across urban and regional areas in Australia. In addition to identifying SA2s with a higher proportion of the population employed in this sector, the total number of employed offers insight into population distribution to further understand the relative effects of the pandemic.
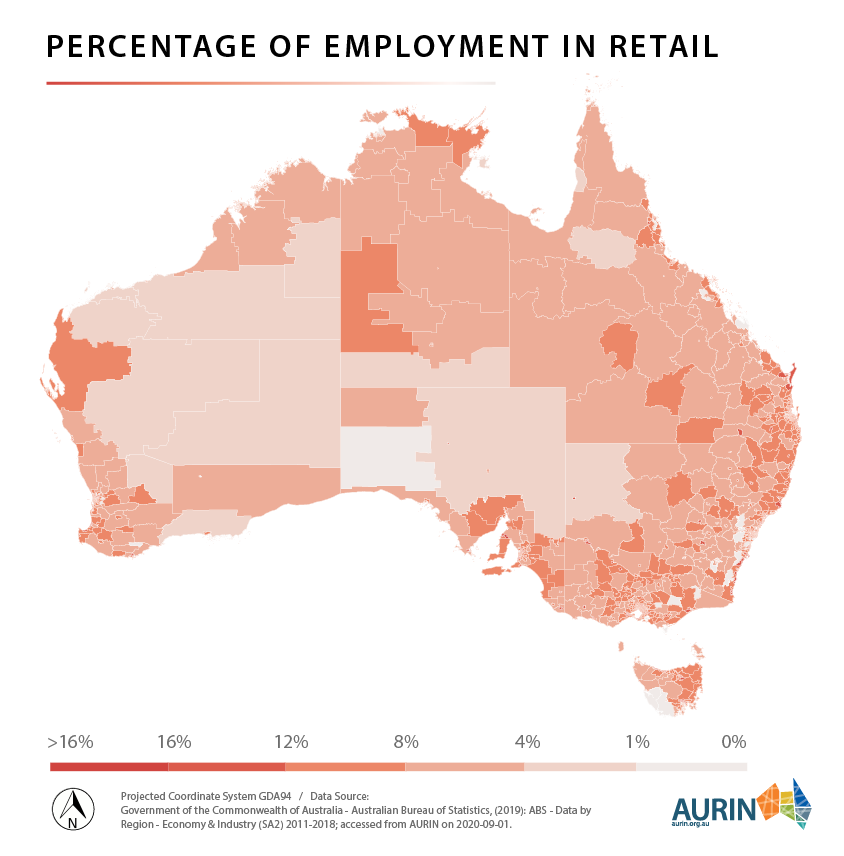
Figure 8: Percentage of persons employed in retail by Statistical Area 2. Data source: ABS (2016).
This is helpful in understanding areas that may be experiencing hardship, depending on state and territory policies and restrictions, as well as the proportion of population that may be affected. Policy makers can use these maps to support data-based recovery efforts and inform future policies to target urban and regional areas that have the highest percentage of population working in Retail.


Figures 9-16: Percentage of persons employed in retail and total number of employed population. Data source: ABS (2016).
Particular attention should be paid to areas such as the New South Wales South Coast. These areas were affected by bushfires at the beginning of the year and then by restrictive travel policies due to COVID-19 pandemic. SA2’s along the coastal area include towns such as Eden, Narooma, Bermagui, Ulladulla, Batemans Bay. These areas record retail employment figures of between 12 and 16%, as well as a considerable proportion employed in Accommodation and Food Services (as shown in the previous case study). Researchers and policy makers can benefit from spatially identifying vulnerable areas to create data-driven policies to better target recovery efforts where they are most needed.
To further understand factors relating to employment vulnerability, the SEIFA Index of Education and Occupation might provide us with helpful insight as the ranking determines “the educational and occupational level of communities” (ABS, 2018).
“Employed people with a qualification were twice as likely to have worked from home than those without a qualification (39% compared to 19%).” (ABS, 2020)
Therefore, a low SEIFA decile ranking (1 and 2) “indicates relatively lower education and occupation status of people in the general area”. This means that a large proportion of people are not working in a highly skilled job or don’t hold a higher education qualification. In the current context of the pandemic, this could point to Retail employees (i.e. sales workers) being less likely to perform their work from home and more likely to be at risk of job loss while restrictions are in place.
A high SEIFA decile ranking (9 or 10) indicates that there are many people in an area with higher education skills and occupations, and only few people without qualifications or working in low skilled occupations. People working in higher skilled Retail Trade jobs (i.e. professionals, managers) are less likely to be exposed to the risk of job loss through restrictive measures, as they are more likely to be able to work from home.


Figures 17 and 18: SEIFA Index of Education and Occupation (SA2). Data source: ABS (2018).
Maps of the SEIFA Index indicate that there is a stark contrast in terms of education and employment vulnerability between capital cities inner and outer areas, as well as regional/rural areas (Figure 17). City centers and inner city areas in Melbourne, Sydney, Brisbane, Perth, Canberra and Hobart record the highest ranking (10), indicating that a large proportion of people is likely to continue working remotely while COVID-19 restrictions are in place.
On the other hand, Melbourne’s outer city areas such as Brimbank, Melton, Broadmeadows, Dandenong record some of the lowest SEIFA ranks (1 and 2), indicating there is a higher proportion of people with lower qualifications or working in low skilled occupations (Figure 18). As metropolitan Melbourne is expected to ease restrictions in the near future, recovery efforts will need to include these areas to restore employment and reduce the risk of economic vulnerability of people working and living in these areas.
We invite researchers to access AURIN and further explore this dataset, investigate how policies drive or decrease the demand for certain jobs and services, as well as contribute to a better understanding of the impacts of COVID-19 on Australian businesses and employment.
As the COVID-19 pandemic continues to create employment vulnerability in many industries which creates a wide variety of research possibilities. Please stay tuned as we will be showcasing data to explore the Arts and Recreation sector.
How can we help you with your research? Please click here to get in touch, or email support@aurin.org.au
Our expert, interdisciplinary team is available to discuss your research needs and provide guidance on the use of AURIN datasets.
Want to get started on your research?
You can access the AURIN Portal and create your own maps and analysis here:

Access data now!
Access ABS Weekly Payroll data and browse further datasets on the AURIN Data Discovery:
This article was written by:
